

In short
Match the laser line to your fluorophore’s excitation curve, not just to a quoted maximum. How much an offset costs depends on the shape and width of that curve.
Power stability and amplitude noise decide how reproducible your numbers are, so specify them with the conditions they hold under.
Use less power than you expect. The ceiling usually comes from saturation, photobleaching and the sample, not from the laser.
Laser-induced fluorescence is among the most sensitive optical measurement techniques available. Most introductions explain the physics and stop there. This one starts from the component that decides whether the method works in practice: the excitation source.
What is laser-induced fluorescence?
A laser excites a molecule into a higher electronic state. The species relaxes and emits a photon at a longer wavelength than the one that excited it. That shift is the Stokes shift, and it is why the method is so sensitive.
Because emission arrives at a different wavelength than excitation, filters can remove most of the excitation light, so the detector sees mainly fluorescence. That is the structural advantage over absorption spectroscopy, which has to resolve a small decrease against a large signal.
The background is never zero, though. Rayleigh and Raman scatter, excitation light the filters do not fully reject, autofluorescence from the sample, the optics and the immersion medium, ambient light and the detector’s own noise all contribute. The sensitivity of LIF comes from combining efficient excitation with good optical and electronic suppression of those terms, not from measuring against nothing. Where that suppression is pushed far enough, in purpose-built and well characterised setups, single molecule detection becomes possible. That is a specialised result, not a property every LIF instrument has.
Laser or lamp: what actually differs
Fluorescence does not require a laser. Plate readers use a lamp with a monochromator, LED sources cover a growing share of routine fluorescence work, and for bulk measurements on concentrated samples either is adequate. Four properties decide when a laser becomes the better answer.
| Property | Lamp or LED source | Laser | Why it matters |
|---|---|---|---|
| Spectral width | typically 10 nm or more through a filter or monochromator | typically well below 1 nm | Exciting one species in a mixture without touching its neighbour |
| Spatial confinement | harder to concentrate into a small, well defined volume | focuses to a tight spot or a thin light sheet | Cytometry, confocal detection, planar imaging |
| Modulation | fast with LEDs, mechanically with a chopper, limited with discharge lamps | direct electrical switching, typically faster | Lock-in detection against ambient light |
| Radiance | limited by the emitting area | very high into a small etendue | How much excitation you can actually get into the measurement volume |
Where none of these matter, a lamp or LED instrument can be the simpler and cheaper choice. Where one of them does, that is usually the reason a laser appears in the design. No single property in the table is exclusive to lasers. It is having all of them together, at high radiance, that is hard to achieve any other way.
Choosing the excitation wavelength
Usually decided for you by the fluorophore, but “as close to the maximum as possible” is only the starting rule. What a given offset actually costs depends on the shape and width of that fluorophore’s excitation curve, and those curves are often broad and asymmetric: the same 20 nm away from the peak can mean a few per cent on one dye and most of the signal on another. Maxima also shift with buffer, pH, binding state and manufacturer. Treat the table below as orientation, then read the excitation spectrum of your actual dye under your actual conditions against your filter set.
| Fluorophore | Excitation max. | Laser line commonly used | Available from RGB |
|---|---|---|---|
| DAPI, DNA bound | around 358 nm | 375 or 405 nm, both on the shoulder | yes |
| Hoechst 33342, DNA bound | around 350 nm | 375 or 405 nm, further off the peak than DAPI | yes |
| Alexa Fluor 405 | around 401 nm | 405 nm, close to the peak | yes |
| CFP and its variants | around 434 nm, varies by variant | 445 nm, usually more efficient than 405 nm | yes |
| GFP, FITC, Alexa Fluor 488 | 488 to 495 nm | 488 nm | yes |
| YFP | around 514 nm | 515 nm | yes |
| Cy3 | around 550 nm | 532 nm on the rising flank, 561 nm closer to the peak | 532 nm, DPSS |
| TRITC | around 557 nm | 532 nm on the rising flank, 561 nm closer to the peak | 532 nm, DPSS |
| Phycoerythrin (PE) | several maxima, around 496, 546 and 565 nm depending on the type | 488, 532 or 561 nm, with different efficiency each | 488 and 532 nm |
| mCherry | around 587 nm | 561 nm | no |
| Texas Red, Alexa Fluor 594 | around 590 to 596 nm | 594 nm, 561 nm is well off the peak | no |
| APC, Alexa Fluor 633 | 632 to 650 nm | 633 or 638 nm | yes |
| Cy5, Alexa Fluor 647 | around 650 nm | 633, 638 or 660 nm | yes |
| ICG and NIR dyes | around 780 nm | 785 nm | yes |
Three practical notes
375 nm sits on the shoulder of the DAPI band, not on its peak, and 405 nm further still. No diode delivers 358 nm at useful power, so most instruments accept the efficiency loss in exchange for a compact, stable source.
CFP is a common mismatch. It is frequently excited at 405 nm because that line is already in the instrument, but 445 nm usually gives noticeably more signal.
561 and 594 nm are listed for completeness. Both are common lines in commercial systems and neither is part of our range.
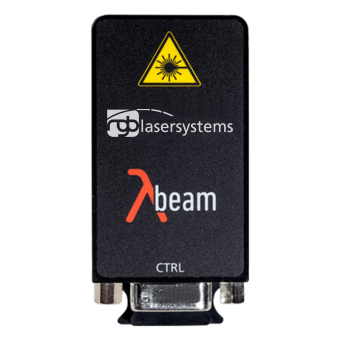 Matching modules
Lambda Beam and Lambda Mini
375 to 1550 nm · free space or fiber coupled · parameters per variant in the datasheet
View range
Lines frequently specified for LIF work: 375 nm, 405 nm, 445 nm, 488 nm, 515 nm, 532 nm, 633 nm, 638 nm, 660 nm and 785 nm.
What the laser has to deliver
Wavelength gets the attention. Four other parameters decide whether your numbers are reproducible. Each of them is only meaningful together with the conditions it was measured under, so ask for those rather than for the headline figure.
| Parameter | What it affects | What to ask for |
|---|---|---|
| Power stability | Fluorescence scales with excitation power, so uncompensated drift becomes a measurement error. A reference channel or power monitor can detect and partly correct it | A figure with the period and the measurement point, and whether it is specified at the laser output or after the fiber |
| Amplitude noise | Appears on the fluorescence signal and raises the detection limit. Independent noise terms combine through their variances, so laser noise only dominates once it exceeds shot noise and detector noise | An RMS figure with the measurement bandwidth and integration time. Separate fast noise from slow drift |
| Wavelength stability | On broad absorption bands it hardly matters. On narrow transitions it decides whether you stay on resonance, and the requirement follows from the transition width | Drift over a stated period and temperature range |
| Beam quality and polarization | Excitation density at the sample and fiber coupling efficiency. Polarization matters for anisotropy measurements and polarization sensitive optics, and little elsewhere | M² and the beam mode plus extinction ratio, at the relevant output and after the fiber if there is one |
Diode lasers shift with temperature, typically by a few tenths of a nanometre per degree. For dye-based LIF on broad absorption bands that is irrelevant. For plasma diagnostics and combustion work, where the measurement follows a narrow transition, it is the central specification, and that is where a narrow linewidth laser with active stabilization earns its cost. See also laser linewidth and coherence length.
If your detection scheme uses lock-in amplification, the source has to be modulatable at the frequency you work at, or the instrument needs a separate modulator. Our Lambda Beam series supports analog and digital modulation; the usable bandwidth differs by variant and is stated in each datasheet.
Power, photobleaching and the ceiling
More power gives more fluorescence, up to a point. Three effects set the ceiling.
- Saturation. Once a large fraction of fluorophores sits in the excited state, adding photons stops producing proportional emission. The signal flattens and your calibration curve bends.
- Photobleaching. Fluorophores are destroyed by the light that excites them. Published photon budgets for common organic dyes span several orders of magnitude, and the figure for any one dye depends strongly on oxygen concentration, buffer, mounting medium and excitation intensity. Treat any single number as an example from one set of conditions, not as a property of the dye class.
- Phototoxicity. On living cells, high excitation also produces reactive oxygen species and local heating. The sample can degrade before the dye does.
Method rather than a number: start at the lowest power that gives a usable signal, raise it stepwise, and stop when signal to noise no longer improves or the sample starts to change. What matters is power density at the sample, which depends on spot size as much as on output power, so a figure in milliwatts means little without the focus it is delivered into.
In pulsed work such as combustion and plasma LIF, pulse energy and fluence govern the result rather than average power, and saturation and damage thresholds have to be expressed in those terms. A milliwatt figure from a microscopy context does not transfer.
LIF in practice: four fields
| Field | What is measured | What the source has to do |
|---|---|---|
| Combustion and flow diagnostics | Two dimensional maps of species concentration and temperature | Sheet forming optics, sufficient pulse energy and fluence at the measurement plane |
| Plasma physics | Ion velocity distribution from the Doppler broadened profile | Narrow, tunable, actively stabilized, with the linewidth matched to the transition |
| Flow cytometry and confocal microscopy | Cell populations separated by fluorescent marker | Multiple lines, high power stability, usually fiber coupled |
| Environmental site investigation | Petroleum contamination in the subsurface, logged in real time | Ruggedized, fiber coupled, tolerant of a wide ambient range |
Specifying the source for an OEM build
In an instrument build the laser is a component that has to behave the same in every unit you ship. Four things belong in the specification.
- Delivery format. Fiber coupling takes alignment out of assembly and makes optical behaviour more reproducible across a series. Free space keeps more power and more flexibility during development.
- Thermal range. State the ambient range the instrument must work in, not the range of your laboratory. Every other specification is conditional on it.
- Control interface. Analog modulation, digital gating or software control over serial, and who writes that integration.
- Footprint and supply. A module needing a rack supply is a different instrument than one running off USB.
We build customized wavelength and power combinations for series applications. See the OEM laser module page.
Frequently asked questions
What is the difference between LIF and fluorescence spectroscopy?
Fluorescence spectroscopy is the general technique and can use any source. LIF uses a laser, which brings a narrow excitation band, spatial confinement and the option to modulate. In practice that allows lower detection limits and spatially or time resolved measurements that a lamp based instrument cannot reach.
Which laser wavelength should I use for LIF?
The line closest to your fluorophore’s absorption maximum that your filter set supports. GFP and FITC: 488 nm. Cy5 and Alexa 647: around 650 nm. DAPI: 375 or 405 nm. CFP: 445 nm rather than 405 nm. For instruments covering several panels, 405, 488, 561 and 640 nm are the usual base set.
How much laser power does LIF need?
Less than most people assume, and there is no general figure. What counts is power density at the sample. The limit comes from saturation, photobleaching and, on living samples, phototoxicity, rather than from available laser output.
Does LIF damage the sample?
Photobleaching destroys the fluorophore permanently and can only be postponed. On biological samples, high excitation also causes phototoxic effects. Keeping power at the lowest level that still delivers acceptable signal to noise is the most effective countermeasure.
Can one laser cover several fluorophores?
Often yes. Absorption bands are typically several tens of nanometres wide, so 488 nm excites GFP, FITC, Alexa Fluor 488 and also phycoerythrin, which has a maximum near 496 nm alongside its longer ones. How well a shared line works still has to be checked per dye and per filter set. Multi line instruments exist to cover the full visible range, not because each dye needs its own source.
Not sure which line fits your fluorophore?
Tell us your dye, the power you need at the sample and whether you want free space or fiber. We will tell you what we would specify and where a measurement is needed instead of an assumption.